Prometheus + Blackbox Exporter 조합으로 Ping(ICMP) 기반 헬스체크 이전 포스팅에 이번 글에서는 Grafana를 이용해 이 데이터를 시각화하고, 서버별로 자동 반복되는 대시보드를 만드는 과정을 다룹니다.
📚 목차
- 구성 개요
- Prometheus + Blackbox Exporter 구성 요약
- Grafana 설치 및 Prometheus 연동
- Ping 상태 대시보드 만들기
- 서버별 자동 패널 구성 (Repeat Panel)
- IP만 표시되도록 Legend/Label 가공
1. 🔧 구성 개요
- 서버는 agent 설치 없이 운영됨
- Blackbox Exporter는 ping(ICMP) 요청만 수행
- Prometheus가
/probe를 통해 Exporter에 요청 - Grafana는 Prometheus 데이터를 시각화
2. ⚙️ Prometheus 구성 요약 (ping 수집)
prometheus.yml 예시:
global:
  scrape_interval: 15s

scrape_configs:
  - job_name: 'icmp_ping'
    metrics_path: /probe
    params:
      module: [icmp]
    static_configs:
      - targets:
          - 8.8.8.8
          - 1.1.1.1
          - 192.168.x.x
    relabel_configs:
      - source_labels: [__address__]
        target_label: __param_target
      - source_labels: [__param_target]
        target_label: instance
      - target_label: __address__
        replacement: blackbox-exporter:9115
3. 📊 Grafana 설치 및 Prometheus 연동
Grafana Docker 설정 (docker-compose 예시)
  grafana:
    image: grafana/grafana:latest
    ports:
      - "3000:3000"
    networks:
      - monitor
    volumes:
      - grafana-storage:/var/lib/grafana
Grafana 접속 후:
- http://localhost:3000
- 기본 로그인: admin / admin
- Data Sources > Prometheus 추가 (http://prometheus:9090) -> Docker Network 기반으로 작성되기 때문에 prometheus 라는 서비스 명을 넣어주시면 됩니다. (docker-compose 서비스명 기준)
4. 📈 Ping 상태 패널 구성
1. 그라파나 접속 -> id=admin, pw=admin 입력 (Default 계정정보) #변경하시면 됩니다.
2. 좌측 네비게이션에 Dashboard -> New Dashboard -> Add visualization -> Prometheus 선택
패널 쿼리 예시:
probe_success{job="icmp_ping", instance=~"$instance"}

- 시각화: Stat 또는 Time Series
- Value mappings:
- 0 → ❌ DOWN
- 1 → ✅ UP
5. 🔁 서버별 자동 패널 반복 구성 (Repeat Panel)
1. 변수 추가
- Dashboard 페이지 -> 우측 상단 Settings → Variables → + New
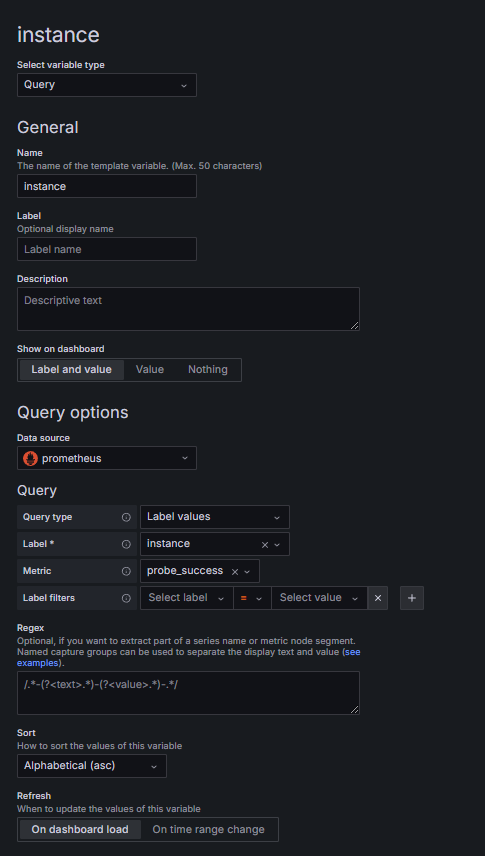
2. 패널에서 반복 설정
- Panel settings → Repeat options
- Repeat by variable: instance
- 방향: Horizontal / Vertical
새로운 서버가 Prometheus에 추가되면(targets.json내부에) 자동으로 패널 생성됩니다.
docker-compose.yml
version: "3.8"

services:
  prometheus:
    image: prom/prometheus:latest
    container_name: prometheus
    volumes:
      - ./prometheus.yml:/etc/prometheus/prometheus.yml
      - ./targets.json:/etc/prometheus/targets.json
    ports:
      - "9090:9090"
    depends_on:
      - blackbox-exporter
    networks:
      - monitor

  blackbox-exporter:
    image: prom/blackbox-exporter:latest
    container_name: blackbox-exporter
    cap_add:
      - NET_RAW
      - NET_ADMIN
    ports:
      - "9115:9115"
    networks:
      - monitor

  grafana:
    image: grafana/grafana:latest
    container_name: grafana
    ports:
      - "3000:3000"
    networks:
      - monitor
    volumes:
      - grafana-storage:/var/lib/grafana

volumes:
  grafana-storage:

networks:
  monitort:
driver: bridge'Infra' 카테고리의 다른 글
| nginx를 활용한 HTTPS 인증 및 Reverse Proxy 구성 방식 (0) | 2025.05.13 |
|---|---|
| SSH 리버스 프록시 기반 원격 지원 시스템 구성 가이드 (0) | 2025.04.16 |
| Prometheus + Blackbox Exporter로 서버 ICMP(Ping) Health Check 구성하기 (3) (0) | 2025.04.09 |
| Prometheus + Blackbox Exporter로 서버 ICMP(Ping) Health Check 구성하기 (0) | 2025.04.07 |

